Source: Photo byChris LiveranionUnsplash
Hello. I’m an AI engineer on Wadiz.
I’d like to introduce “Prophet,” a time-series analysis packageWadizadopted last year, and explain how we use it to forecast monthly funding amounts.
Existing Methods for Predicting Monthly Funding Amounts
Wadiz, a crowdfunding platform, a large volume of funding-related data is generated and accumulated in real time. One of the most important metrics among these is likely revenue. Accurately forecasting the funding amount—a key indicator of revenue—is essential for evaluating the company’s performance and forecasting its future. For this reason, even before implementing the Prophet model, we had been using a relatively simple method to forecast monthly funding amounts.
Before implementing Prophet, we used the "simple average method." This method predicts the daily funding amount by calculating the average of actual daily funding amounts based on the cumulative number of days starting from the first day of the forecast month. While this method has a large margin of error at the beginning of the month, it gradually self-corrects as the month progresses, reducing the error. However, a drawback is that by the end of the month, the error is so small that anyone could make the prediction, effectively rendering the method unnecessary.
Another drawback is that the margin of error can become quite large after two or three months. Since the estimate is based on a simple average, it fails to reflect long-term growth trends or weekly and monthly seasonality. As a result, the accuracy of predictions for the distant future—five or six months down the line—is bound to be very low.
In Search of Better Prediction Methods
The initiative to "introduce a forecasting model" began with the goal of improving our existing method for predicting monthly funding amounts.
First, we tested a range of forecasting models, including traditional statistical models such as ARIMA, SARIMA, and ETS, as well as state-of-the-art neural network-based models like GRU, LSTM, DeepAR, and Temporal Fusion Transformer. The traditional statistical models (such as ARIMA) are local models that learn from long-term data to identify trends and patterns, but they were not suitable for forecasting. In the case of neural network-based models, we found that their predictive power was actually lower, as they tended to overfit to outliers or noise.
Prophet is known for its ability to learn effectively from long time series and for its robustness against outliers and noise. We determined that it is lightweight, trains quickly, and is easy to analyze.
That is why we decided to adopt Prophet.
Prophet
Prophet is a library created by Facebook (now Meta) in 2017 to handle time series data. It automatically generates forecasts based on time series data without requiring statistical knowledge, and is said to be relatively robust in modeling even in the presence of outliers or missing data.
*Note: Official Prophet website
Facebook has developed tools that enable "domain" experts to analyze and apply time-series data on their own, without the need for professional time-series analysts or statisticians. The company developed a model that simplifies the shortcomings and complexity of traditional statistical time-series analysis models—such as ARIMA, ETS, and TBATS—and packaged and released it as Prophet.
1. Prophet Model
This is an additive model composed of several components, as shown below.
y(t) = g(t) + s(t) + h(t) + εt
Here is a brief description of each component:
- g(t) is a trend function that models non-periodic changes over time. It is modeled using linear models, such as the Linear function, or S-shaped models, such as the Logistic function, divided into intervals.
- s(t) detects and models changes that exhibit periodicity on a weekly, monthly, and annual basis.
- h(t) models variations such as holidays, vacations, and irregular events.
- ϵtaccounts for unusual changes that cannot be modeled.
Simply put, as explained earlier, we generalize each of the above components using an additive model and combine them to calculate the final y(t). (Of course, it’s actually more complicated than that…😅)
2. Installing Prophet
- Installing on Linux
On Linux, use the code below to install the software. In the case of pystan, you must install this specific version due to compatibility issues with other versions. If another version is already installed, it’s best to set up a virtual environment and install it there, or install it fresh before proceeding with the installation of Prophet.
$ pip install pystan==2.19.1.1
$ pip install prophet
- Install on a Mac
Installing it on a Mac is the same as installing it on Linux, but you may encounter the following error when installing the stan package.
Failed to build prophet
Installing collected packages: pymeeus, korean-lunar-calendar, hijri-converter, ephem, convertdate, setuptools-git, pystan, LunarCalendar, holidays, cmdstanpy, prophet
Running setup.py install for prophet ... error
ERROR: Command errored out with exit status 1:
command: /Users/taekgoo.kim/opt/anaconda3/bin/python -u -c 'import sys, setuptools, tokenize; sys.argv[0] = '"'"'/private/var/folders/8r/4wg9cnks1pbcy18k8h0q31kd30ljx5/T/pip-install-y53ha47p/prophet_c75b6208bc884daba052e08f6a385f14/setup.py'"'"'; __file__='"'"'/private/var/folders/8r/4wg9cnks1pbcy18k8h0q31kd30ljx5/T/pip-install-y53ha47p/prophet_c75b6208bc884daba052e08f6a385f14/setup.py'"'"';f=getattr(tokenize, '"'"'open'"'"', open)(__file__);code=f.read().replace('"'"'\r\n'"'"', '"'"'\n'"'"');f.close();exec(compile(code, __file__, '"'"'exec'"'"'))' install --record /private/var/folders/8r/4wg9cnks1pbcy18k8h0q31kd30ljx5/T/pip-record-rduv76rs/install-record.txt --single-version-externally-managed --compile --install-headers /Users/taekgoo.kim/opt/anaconda3/include/python3.8/prophet
cwd: /private/var/folders/8r/4wg9cnks1pbcy18k8h0q31kd30ljx5/T/pip-install-y53ha47p/prophet_c75b6208bc884daba052e08f6a385f14/
Complete output (10 lines):
running install
running build
running build_py
creating build
creating build/lib
creating build/lib/prophet
creating build/lib/prophet/stan_model
Importing plotly failed. Interactive plots will not work.
INFO:pystan:COMPILING THE C++ CODE FOR MODEL anon_model_dfdaf2b8ece8a02eb11f050ec701c0ec NOW.
error: command 'gcc' failed with exit status 1
If you encounter this error, please follow the steps below and then try the installation again.
$ xcode-select --install
$ pip install pystan==2.19.1.1
$ pip install prophet
3. Prophet Features
The key features of Prophet are as follows.
- Saturation Forecast: You can predict saturation by setting maximum or minimum growth or decline thresholds. Using Wadizas an example, saturation refers to the maximum projected growth potential. This forecast can account for potential constraints such as market size or regulations.
- Trend Change Points: You can automatically identify and distinguish points where an upward or downward trend changes. In fact, after training Prophet, you can check for trend change points with just one or two lines of code.
- Seasonality, Holiday Effects, and Regressors: You can make predictions that account for seasonal variations or effects such as holidays and weekends. You can also add separate variables (regressors) to automatically incorporate them into your predictions.
- Multiplicative Seasonality: While seasonality is typically fitted as an additive component, it can also be fitted as a multiplicative component and used in forecasting. In such cases, the forecast shows an increasing amplitude over time.
- Uncertainty Intervals: The model determines uncertainty intervals for trends, seasonality, or additional noise and includes them in the yhat variable in the output.
- Outliers (Outlier Handling): If you set outliers to NA, the system automatically performs interpolation to remove or handle them.
- Non-Daily Data: This can include hourly data, monthly data, or data covering specific time periods.
- Diagnostics (Model Diagnostics): This feature supports cross-validation and parameter tuning for models. We utilized this feature Wadizto perform cross-validation and parameter tuning. We have identified the best results and are currently deploying and operating the model.
Collecting Training Data
After collecting the data, we analyzed it to prepare it for training the model before proceeding with modeling using the key features.
Wadizis a platform that differs in nature from traditional e-commerce sites. Consequently, the types and formats of data required to predict funding amounts are also different. Keeping this in mind, we collected data while considering which features might influence the total funding amount.
We already have several data analysts, data engineers, and machine learning engineers working at Wadiz. Thanks to them, we were able to save time on decision-making.
We selected approximately 140 features from the metrics collected daily in our internal database. Based on our own analysis and advice from colleagues, we prioritized features with a high correlation to funding projects. As a result, we ended up using only a portion of the 140 data points. We excluded data with low relevance to funding projects, as well as data with high NA rates or excessive noise.
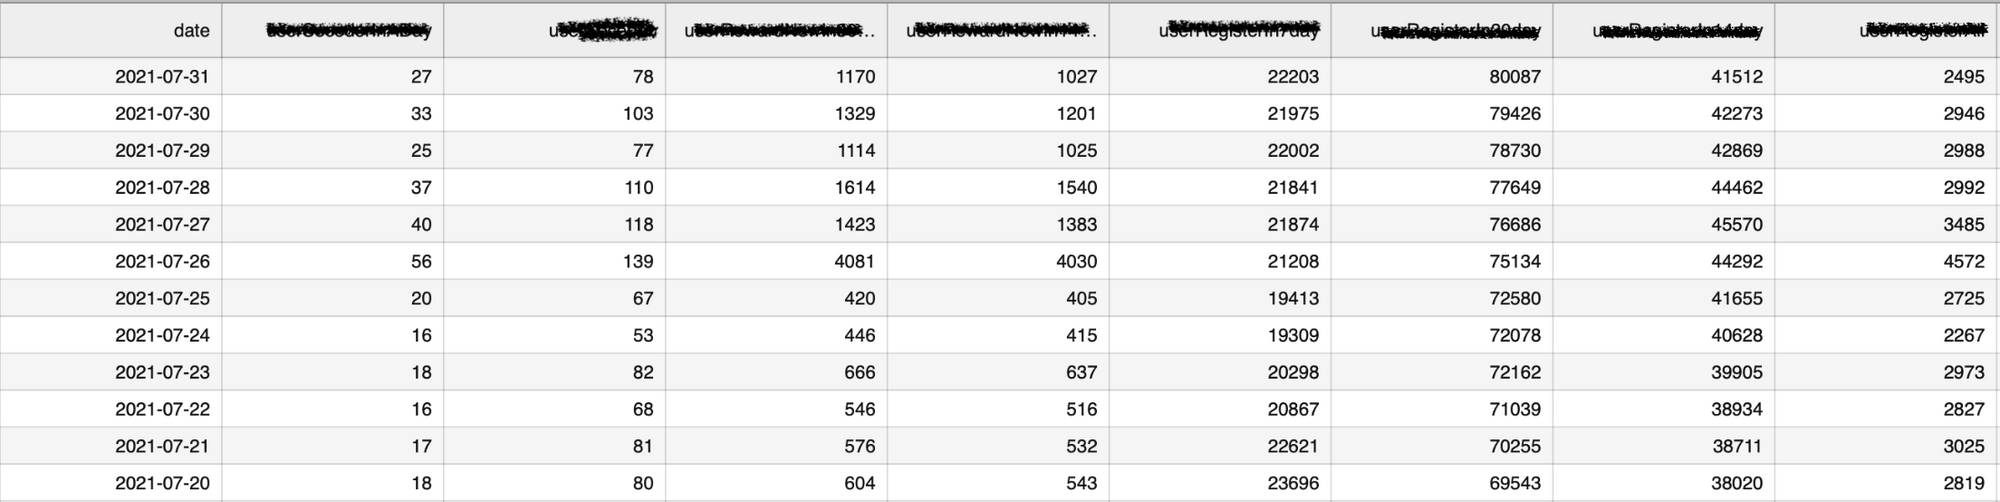
The scope of data collection and the features used to analyze data characteristics prior to training are as follows.
- Data collection period: January 1, 2017–July 31, 2021
- Feature: 25 features that appear to be highly correlated with funding amounts. Below are some of these features.
- Daily funding amount
- Number of daily funding participants
- Daily funding cancellation amount
- Daily likes
- Number of signatures collected per day
- Number of notification requests per day
- DAU: Daily Active Users
- MAU: Monthly Active Users
- Number of projects completed per day
- Number of ongoing projects
- Number of projects created per day
- Number of project reviews per day
- Number of successful projects per day
- Number of new members
- (Omitted)
Out of a total of 140 features, we began collecting and analyzing approximately 25 features, including the data mentioned above.
Data Exploration
1. Heatmap Analysis
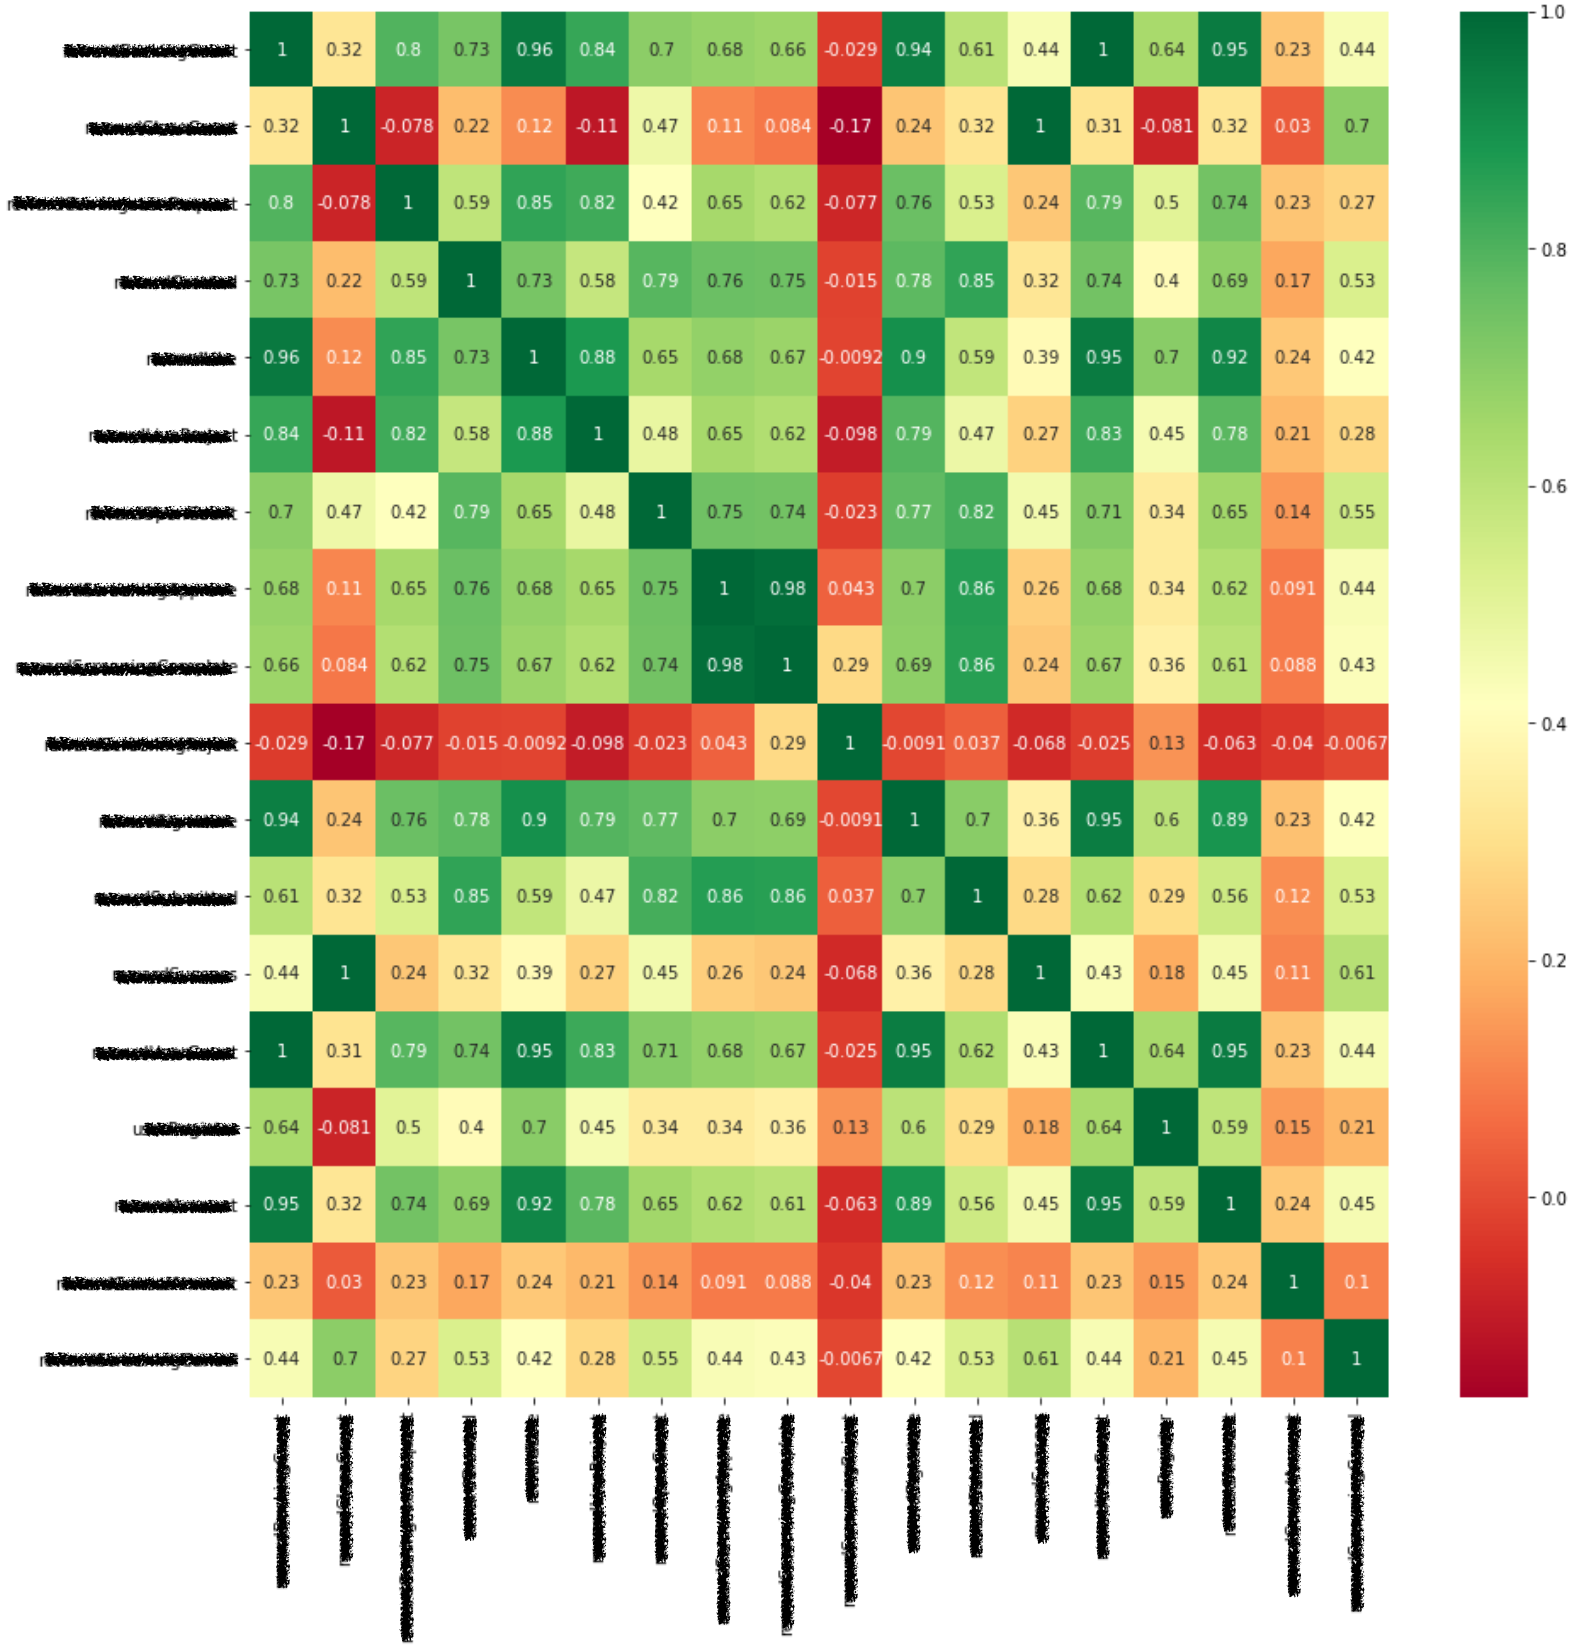
Let’s take a look at heatmaps, which are one of the simplest ways to visualize the relationships between various features during data analysis.
I used the Heatmap chart from the Seaborn package to identify correlations between features, as shown below.
The red-yellow-green gradient on the right illustrates the degree of association for each feature. It provides an intuitive representation where red indicates a lower association, while a deeper shade of green indicates a higher association.
The X-axis and Y-axis represent features, and the diagonal line in this heatmap indicates the correlation between them. Therefore, as shown in the figure below, the diagonal line represents a correlation of '1'.
I’ve created a table showing only the correlations with the funding amount—the target of the prediction—from the table above, prioritizing those results.
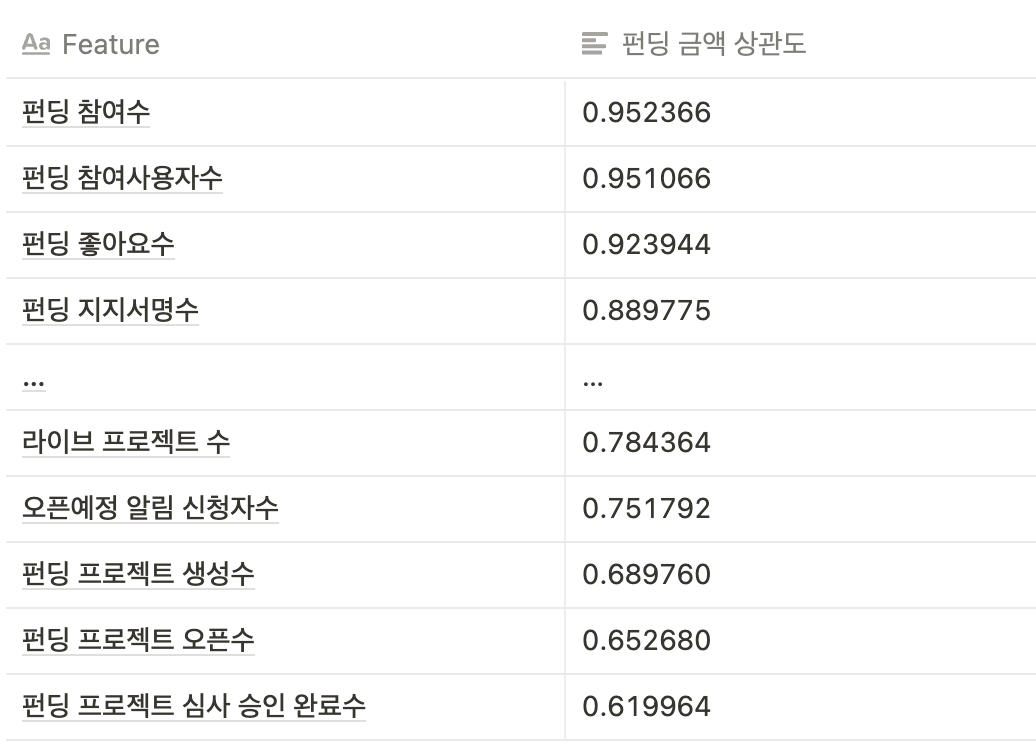
In fact, as shown in the table above, “Number of Funding Campaigns” and “Number of Funding Participants” are highly correlated with the total funding amount. However, since a supporter’s participation in a funding campaign is the metric that drives the funding amount, these variables should be excluded from analysis or machine learning models (due to significant collinearity).
In particular, when using linear models, if you duplicate essentially the same metrics—such as funding amount, number of funding campaigns, and number of users participating in funding—a specific feature may be overrepresented, which can actually lead to a decline in model performance.
2. Feature Importance
I used the Tree Model from the Scikit-Learn package to measure feature importance.
Feature importancerefers to the "priority order of features as perceived by the model"—specifically, the criteria the tree model uses to determine which features to prioritize when creating tree nodes in order to achieve a clean classification.
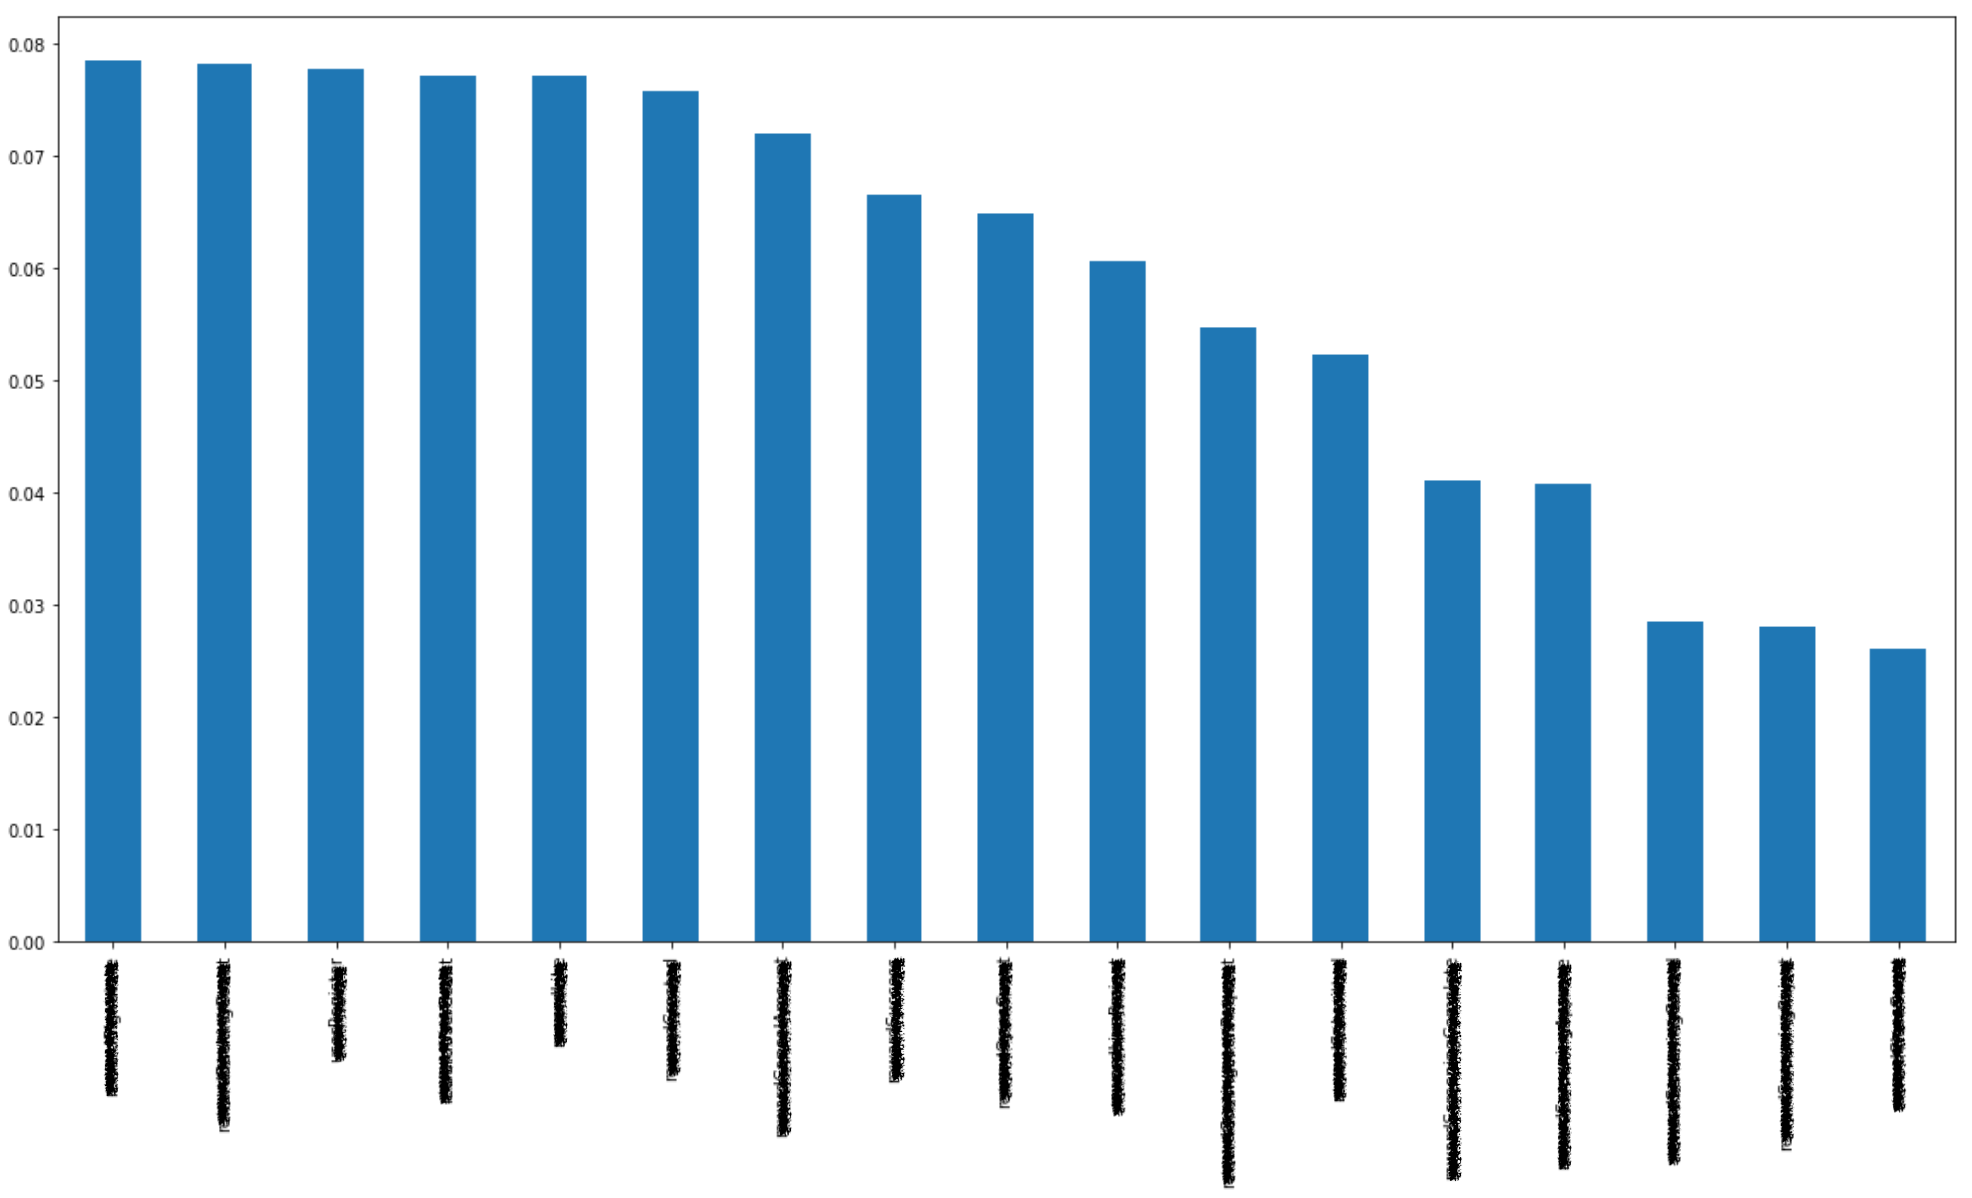
The importance of each key feature is shown in the table below.
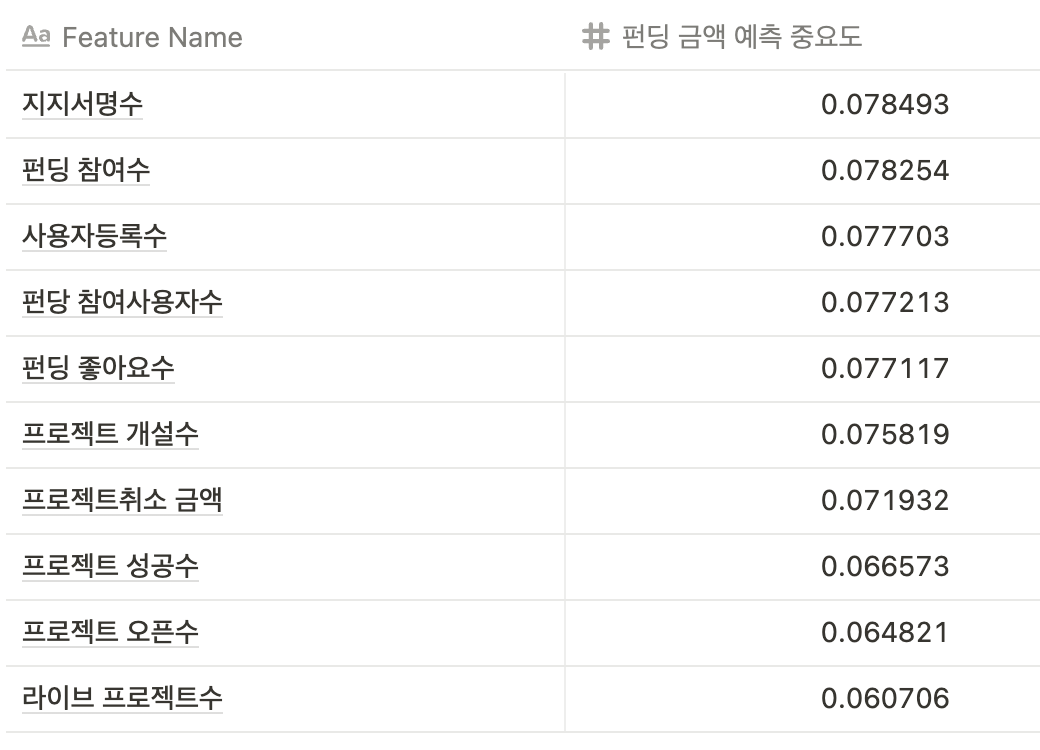
You can see that the correlation with funding amounts and the model's predictive importance differ. However, this data is part of an exploratory process to select the data to be used for actual training. We won't be using all of it.
In fact, funding amount data is time-series data, so it may be influenced by its own patterns or external factors (such as holidays or weather) regardless of its correlation with or importance relative to other features. Furthermore, changes over timeare not reflected in the analysis method described above.
Selecting Data for Training
From the 25 data points selected above, we excluded those—such as “number of users participating in funding” and “number of funding participations”—that appeared to exhibit high collinearity with the funding amount based on their correlation and importance. We first selected the four features that overlapped among the top five items.
- Number of live projects
- Number of subscribers to the opening notification
- Number of "Likes" on the funding page
- Number of funding signatures
Next, we used this training data to begin building the model in earnest.
Building a Time Series Forecasting Model Using Prophet
1. Building a Simple Time Series Forecasting Model Using Only Funding Data
First, I tried to see if I could build a predictive model based solely on the patterns or trends in the funding amounts over time.
Model Evaluation Metrics
The model's evaluation metrics primarily used the Mean Absolute Percentage Error (MAPE), with the Mean Absolute Error (MAE) serving as a supplementary metric.
Importing and Training Data
I converted the data from January 1, 2017, to June 30, 2021, into a dataframe and set aside the last month for backtesting. I conducted an evaluation to establish a baseline using Prophet’s default parameters.
from prophet import Prophet
from sklearn.metrics import mean_absolute_error, mean_absolute_percentage_error
df = pd.read_csv('../data/KPIDay.20170101.20210630.train.csv', index_col=0)
train_df = df.head(-30)
m = Prophet(seasonality_mode='additive')
m.fit(train_df)
Creating a Data Frame for Prediction and Making Predictions
You can run a prediction with just a few lines of code, as shown below.
Create a dataframe in `future_df` that includes past data as well as future dates to be predicted. The system will then automatically generate predicted values based on this data and output them into a dataframe named `forecast`.
future_df = df.copy()
future_df.rename(columns={'date':'ds'},inplace=True)
forecast = m.predict(future_df)
Plotting Training/Prediction Results
You can use the model m we learned about above to plot the predefined chart shown below.
fig1 = m.plot(forecast, figsize=(20,10), xlabel='year-month', ylabel='reward amount')
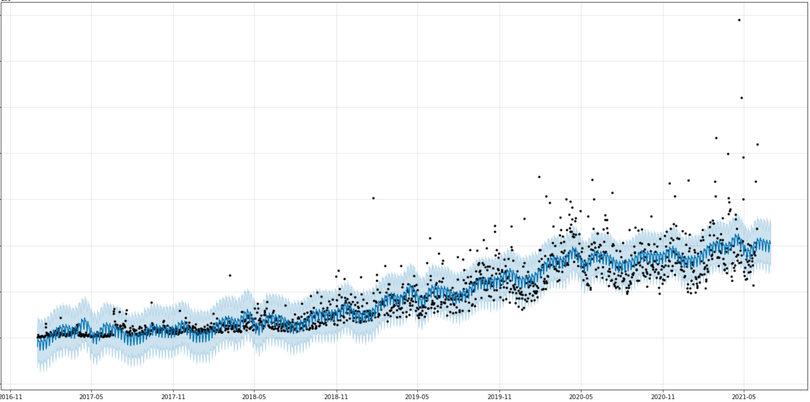
The x-axis represents the funding amount, the y-axis represents the year-month, and the black dots are the actual data points. The solid blue line shows the model’s predictions. It effectively captures the upward trend and the patterns of rises and falls. The light blue areas represent the lower 10% and upper 90% ranges of the uncertainty predictions.
In the chart above, the section on the right labeled "2021-06" does not show any actual data points (represented by black), but you can see that predictions were made based on the pattern.
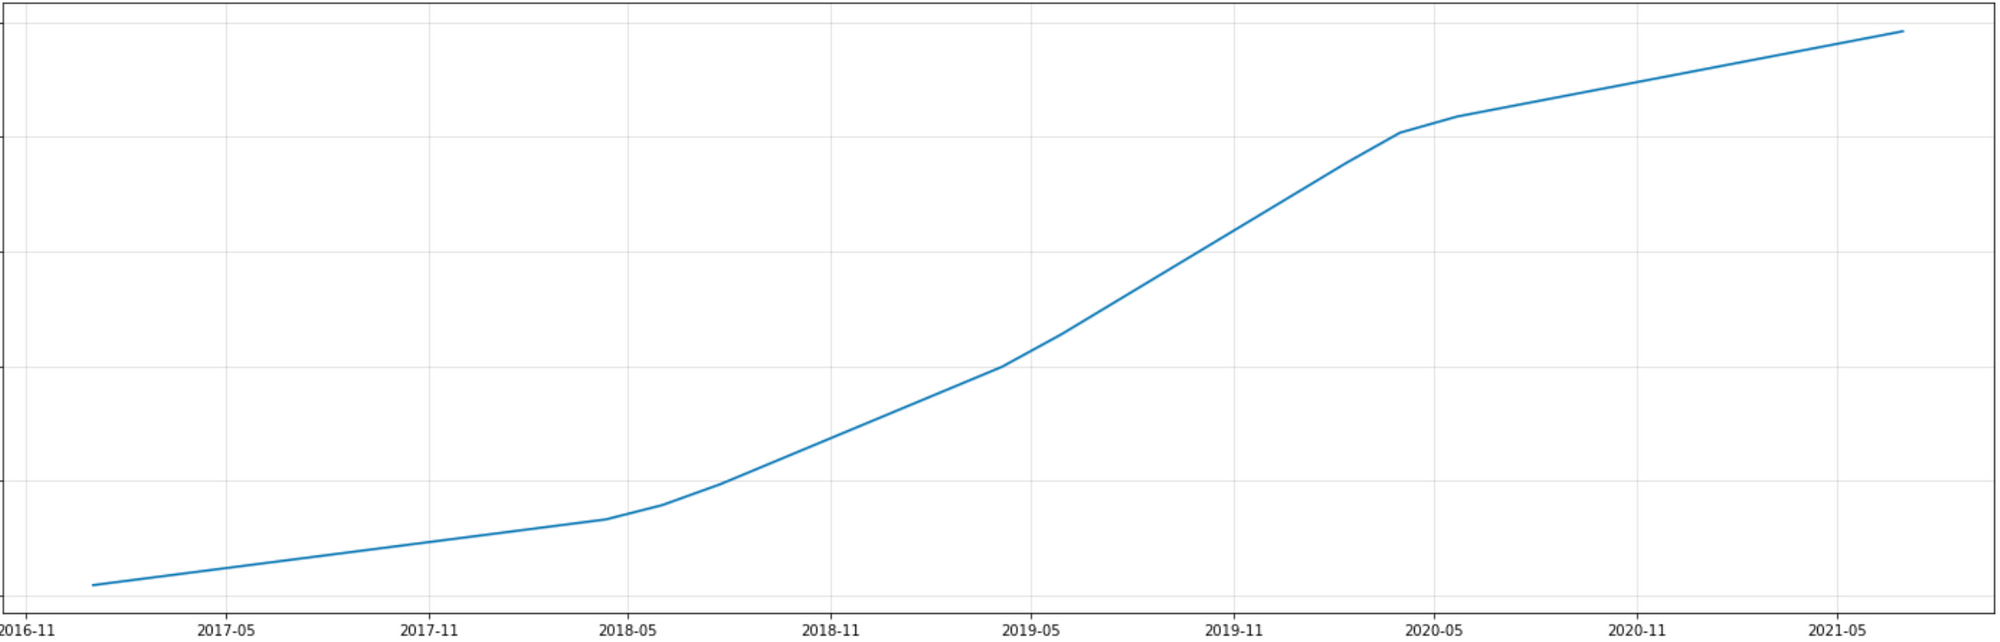
In addition, each component of the model (g(t), s(t)) can be plotted easily as shown below.
fig2 = m.plot_components(forecast, figsize=(20,20))
Trend
Weekly Pattern
Annual Pattern
To briefly interpret the chart above,
- The trend in funding amounts continues to rise, with particularly notable growth observed between May 2018 and May 2020 compared to other periods.
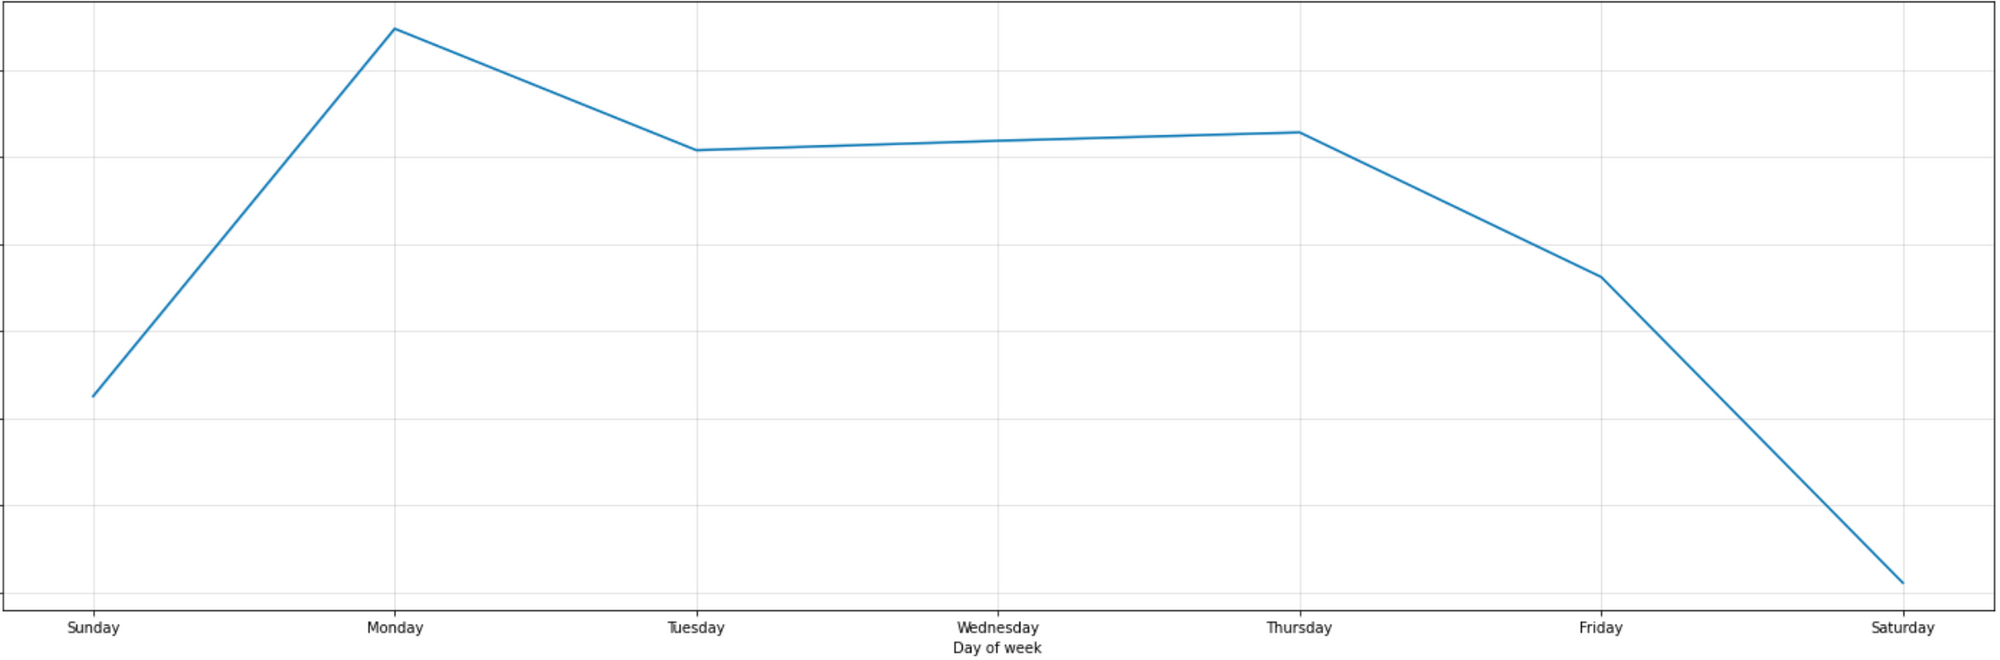
- The weekly pattern shows that funding amounts are highest on Mondays, remain steady throughout the week, and are lowest on weekends.
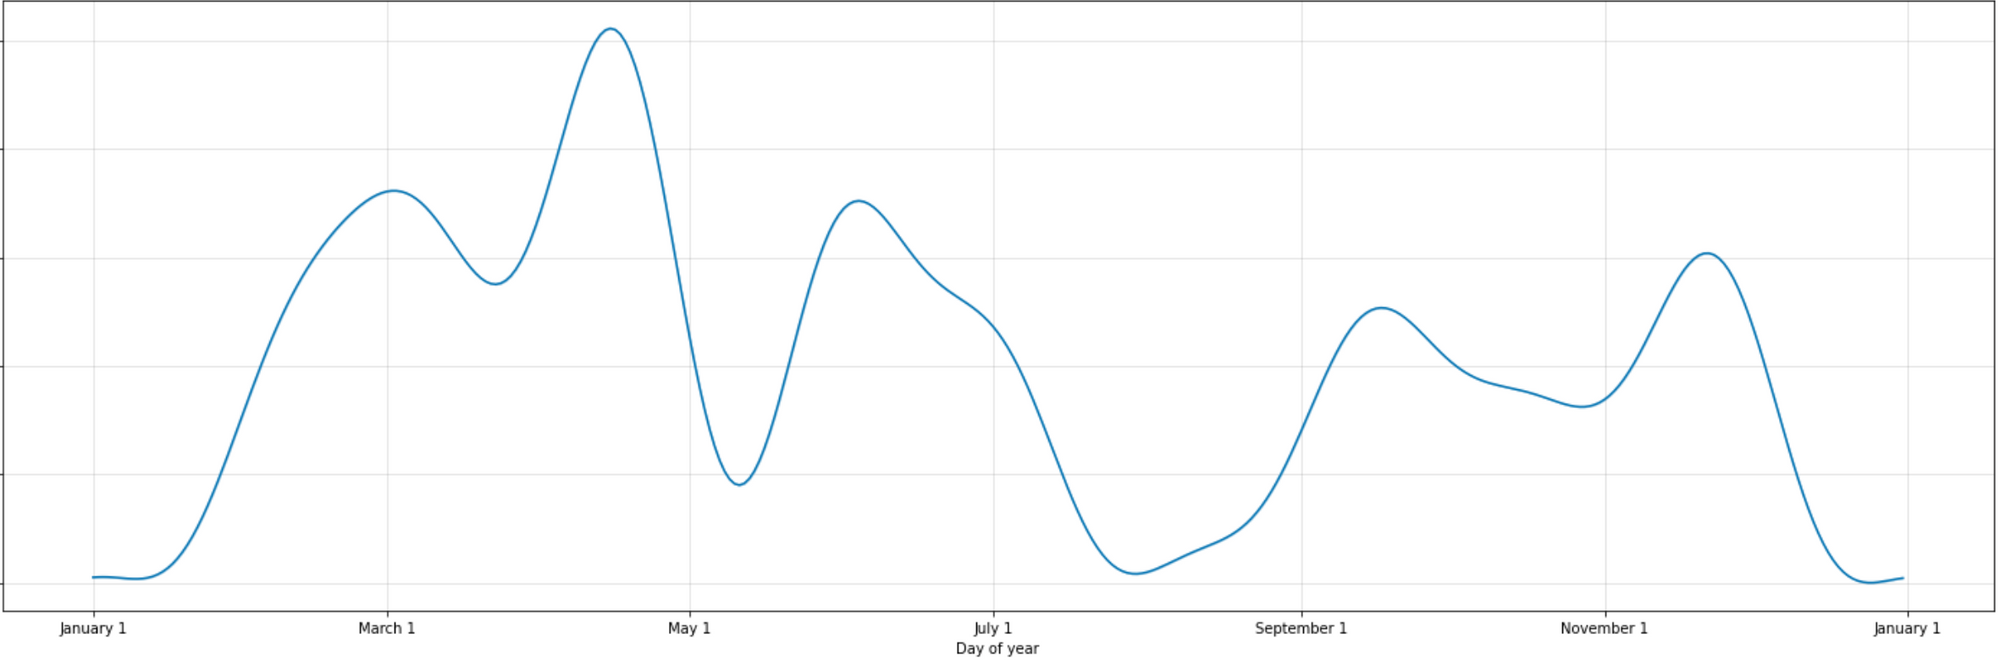
- The annual pattern shows that funding amounts are highest in the spring (March–April) and lowest during the summer (July–August) and winter (January). Interestingly, this coincides with vacation and school break seasons.
Please keep in mind that this pattern is not always the same; it may vary depending on the data range (changes in the time period or additional data) or the model parameters.
This is the result of modeling based solely on the funding amount—which is purely a matter of prediction—and training the model using its default parameters.
2. Building a time series forecasting model by adding additional features
Next, let’s examine how adding features affects performance and how changes in model parameters impact it. We conducted this analysis using the Grid Search feature provided by Prophet.
Previously, we selected four features based on their correlation with funding amounts and their importance, as determined by data analysis. We will now use these features to build a model.
To summarize, we first tuned the model’s parameters and then experimented with different feature combinations to optimize the model.
2-1. Optimizing Model Parameters Using Grid Search
To optimize the model parameters, we applied a combination of parameter tuning ranges recommended by the Prophet developers using a grid search method. While it can be difficult to understand the meaning of these parameters, using a grid search is extremely helpful in finding the appropriate ones.
Definition of Search Space
For tunable hyperparameters, I referred to the guidelines on the official Prophet website below.
* Note: Diagnostics
- changepoint_prior_scale: This parameter is said to be the most effective at reflecting the magnitude of changes in the trend. The default value is 0.05, and the developers recommend a range of 0.001 to 0.5. We recommend tuning this parameter on a logarithmic scale.
- seasonality_prior_scale: A unit used to reflect seasonality; the default value is 10, and values between 0.01 and 10 are generally considered appropriate.
- holidays_prior_scale: A unit that reflects the effect of public holidays; the default value is 10, and a value between 0.01 and 10 is generally considered appropriate.
- seasonality_mode: Select either "additive" or "multiplicative" to determine whether the seasonal effect is added to or multiplied by the data. The default is "additive"; if you select "multiplicative," the amplitude will increase over time.
- holidays: A dataframe containing information on public holidays in South Korea
For your reference, you can generate a data frame containing public holiday information using the code below.
import holidays
# 필요한 날짜만큼 생성
date_list = pd.date_range('2017-01-01', '2021-12-31')
# 한국 휴일 객체 생성
kr_holidays = holidays.KR()
# generate holiday table
holiday_df = pd.DataFrame(columns=['ds','holiday'])
holiday_df['ds'] = sorted(date_list)
holiday_df['holiday'] = holiday_df.ds.apply(lambda x: kr_holidays.get(x) if x in kr_holidays else 'non-holiday')
Search Space is defined as follows, including public holiday information.
search_space = {
'changepoint_prior_scale': [0.05, 0.1, 0.5, 1.0, 5.0, 10.0],
'seasonality_prior_scale': [0.05, 0.1, 1.0, 10.0],
'holidays_prior_scale': [0.05, 0.1, 1.0, 10.0],
'seasonality_mode': ['additive', 'multiplicative'],
'holidays': [holiday_df]
}
Grid Search: Combination and Execution
Generating all combinations based on the search_space defined above yields a total of 192 combinations, and we performed training using these 192 different hyperparameters according to the process described below.
- Perform cross-validation on all possible combinations
- initial: After completing at least two years of training (starting January 1, 2017)
- period: every 90 days
- horizon: Review of the 30th
- After performing cross-validation, calculate the performance metric (MAPE; mean absolute percentage error) and store it in `tuning_results`
- Daily Forecast Values, Actual Values, and Error Rates
I recorded the overall performance results and noted the best combination of hyperparameters for use.
param_combined = [dict(zip(search_space.keys(), v)) for v in itertools.product(*search_space.values())]
mapes = []
for param in param_combined:
print('params', param)
_m = Prophet(**param)
if regressors is not None:
for regressor in regressors:
_m.add_regressor(regressor)
_m.fit(train_df)
_cv_df = cross_validation(_m, initial='730 days', period='90 days', horizon='30 days', parallel='processes')
_df_p = performance_metrics(_cv_df, rolling_window=1)
mapes.append(_df_p['mape'].values[0])
tuning_results = pd.DataFrame(param_combined)
tuning_results['mapes'] = mapes
Although Prophet is fast and lightweight, it took over a full day to find the optimal solution among all 192 combinations. The results are shown below.
Results of the Grid Search
The results of the grid search can be summarized as follows.
- The best combination is
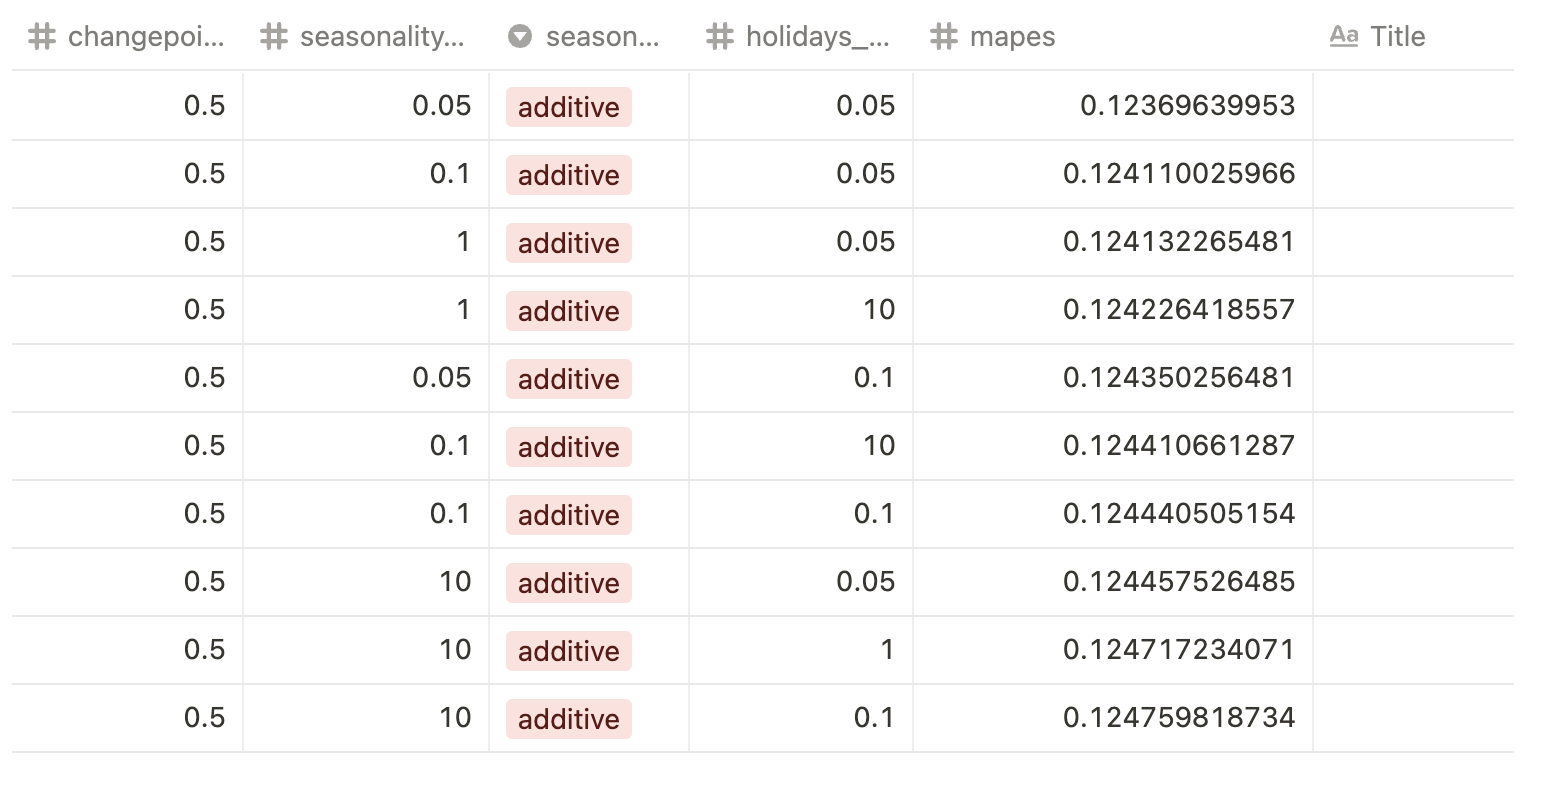
- changepoint_prior_scale: 0.5, seasonality_prior_scale: 0.05, holidays_prior_scale: 0.05, seasonality_mode: additive
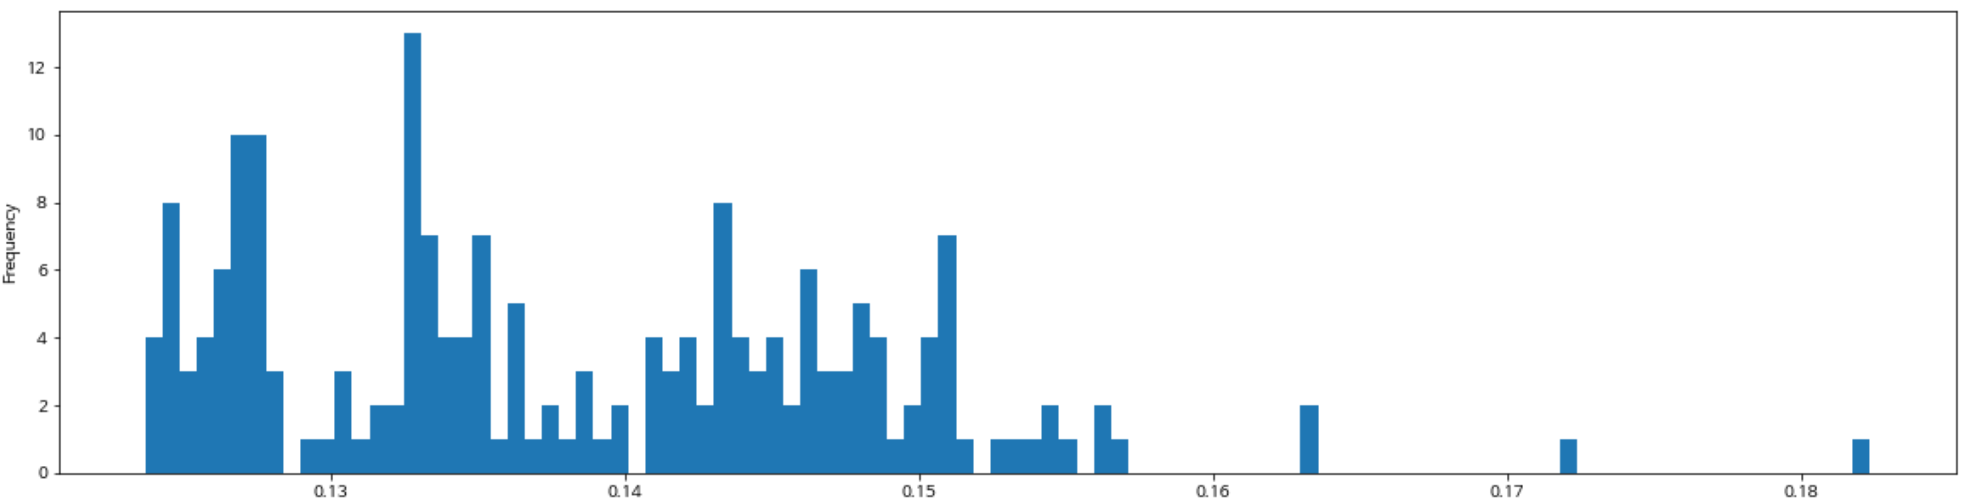
- Range: 0.1237–0.18
- Average: 0.14
- Standard deviation: 0.01
- Given that the standard deviation is small,with the exception of a few outliers in MAPE 0.16 and above , I concluded that the model is not highly sensitive to hyperparameters and that we simply need to avoid combinations that produce poor MAPE results.
- When changepoint_prior_scale was set to 0.5 or 0.05 and seasonality_mode was kept at additive, no significant drawbacks were observed in the metrics.
The chart below shows a histogram of the model's performance (MAPE). You can see that the values are mostly clustered between 0.12 and 0.15.
The table below shows the parameter combinations for the top 10 models that performed best out of the 192 models trained. As shown in the table, changepoint_prior_scale and seasonality_mode appear to have the greatest impact. The other parameters seem to have a relatively minor effect.
2-2. Model Tuning Using Additional Features Beyond the Funded Amount
In Prophet, a model that uses additional features for prediction is defined as a "regressor." Here, we used the four related features identified through the data analysis performed earlier.
Defining Regressor Combinations
We conducted experiments on different combinations of regressors by combining the additional features listed below.
- RewardLike: Number of "Likes" on the funding page
- RewardSignature: Number of funding support signatures
- RewardLiveProject: Number of live projects
- RewardComingsoonRequest: Number of users who have signed up for upcoming release notifications
We conducted experiments to find the best combination by mixing and matching the features listed above. The model was generated using the code below, and we applied the optimal parameters identified in our previous experiments.
We also conducted eight back-tests across different time periods to evaluate the model’s volatility and its ability to make stable predictions.
regressors = ['rewardLike', 'rewardSignature', 'rewardLiveProject', 'rewardComingsoonRequest']
regressors_list = []
for L in range(0, len(regressors)+1):
for subset in itertools.combinations(regressors, L):
regressors_list.append(list(subset))
Results of the Regressor Combination Experiment
- The prediction model that used only ‘Live Project Su’ as the regressor showed the best average MAPE.
- For the model using "Live Project S," while the average performance across the eight backtests was excellent, there appeared to be some variation. In other words, there is a significant gap between instances where the model performs well and those where it does not.
- However, while the model combining "number of funding signatures" and "live projects" showed a slightly lower average MAPE, it had the smallest variance. In other words, the gap between successful and unsuccessful predictions is narrow, suggesting that the model adapts well to changes.
The chart below visualizes the performance (MAPE) of each model combination. You can see that combining the models with a Regressor results in a significant improvement in performance compared to the simplest model (olive green) before tuning.
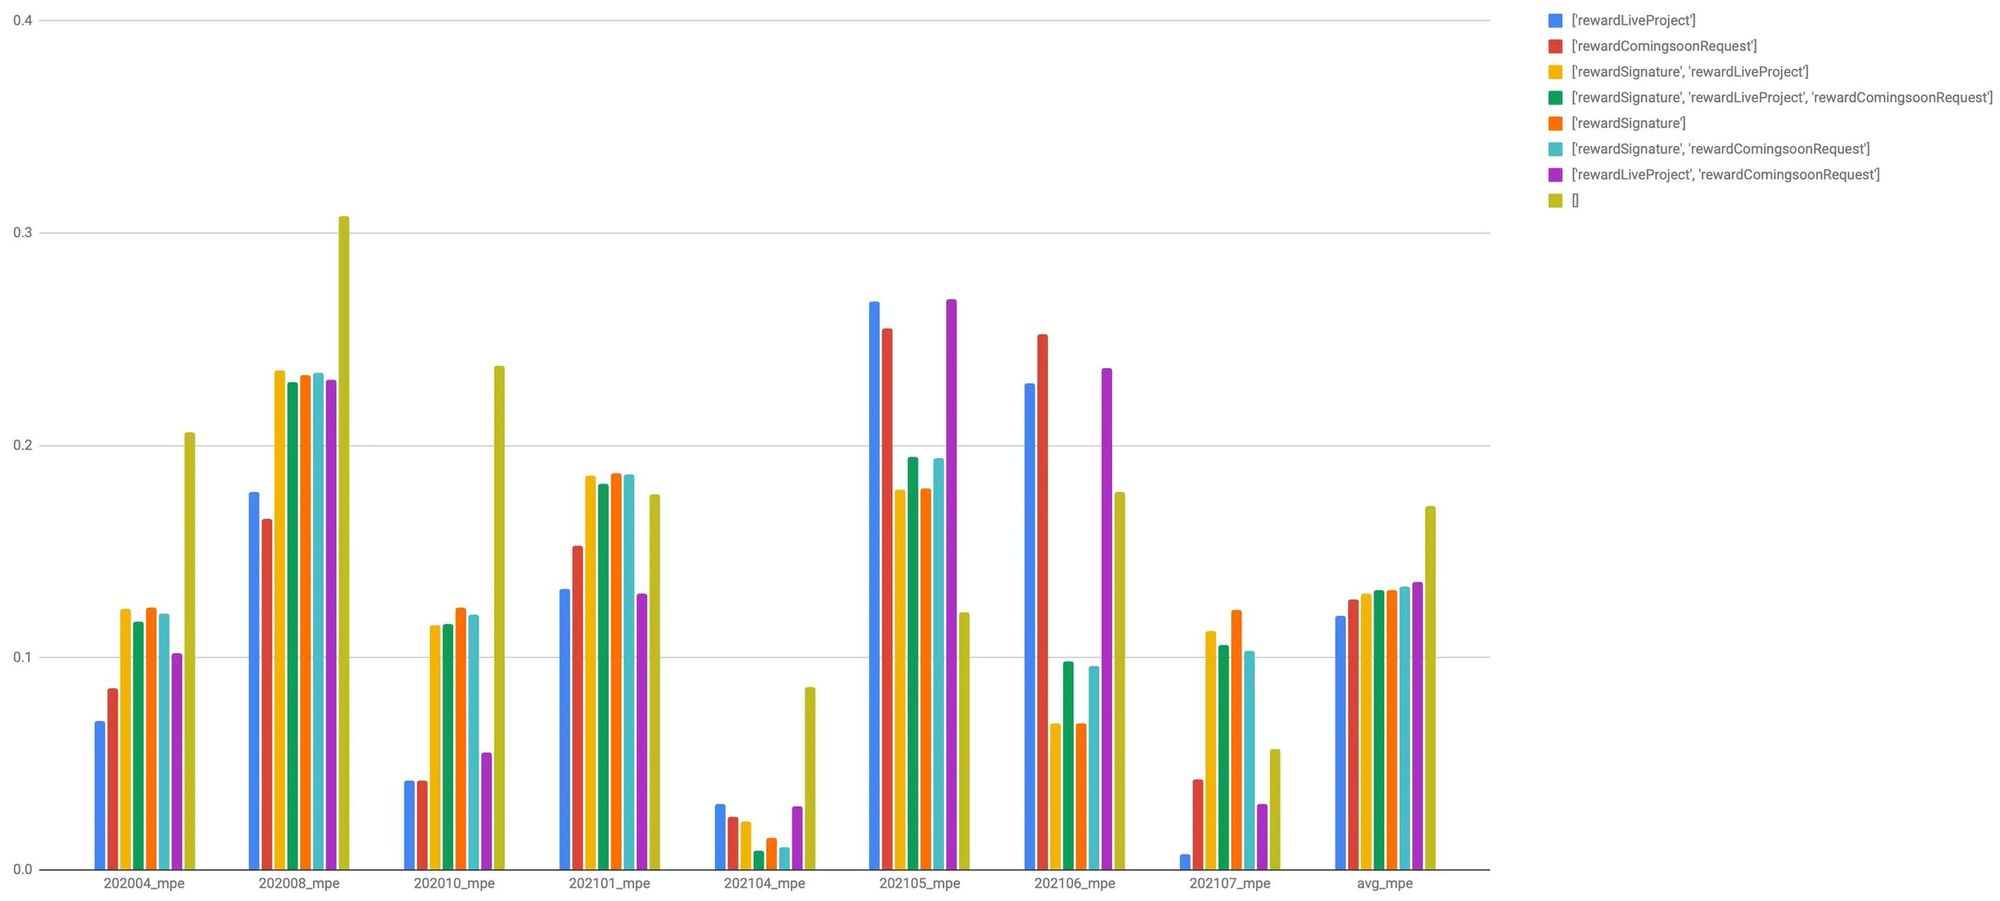
Summary of Final Model Combinations
Through these two separate experiments
- The hyperparameters are defined as follows: changepoint_prior_scale: 0.5, seasonality_prior_scale: 0.05, holidays_prior_scale: 0.05, and seasonality_mode: additive,
- Regressor has added "number of funding endorsements" and "live projects"
We therefore proceeded with the setup for deployment.
Due to the nature of the Prophet model, additional regressors must first be trained and used to make predictions before their output values can be utilized as inputs (regressors) for the “funding amount prediction” model. When using predicted values as inputs for other training processes, it is important to be mindful of error propagation. This is because error propagation can significantly increase the error of the “funding amount prediction” model, which is the final target of prediction.
We determined that the “number of funding signatures” and the “number of live projects” had a narrower range of variation and a relatively lower error rate than the funding amount, and thus decided to use them for training.
Model Deployment
Through model optimization, we found that the model’s error rate averaged around 11% based on eight backtests. We determined that it was suitable for practical application and deployed the model for operation. Here is a brief overview of the architecture and workflow we built.
Introduction to the Architecture
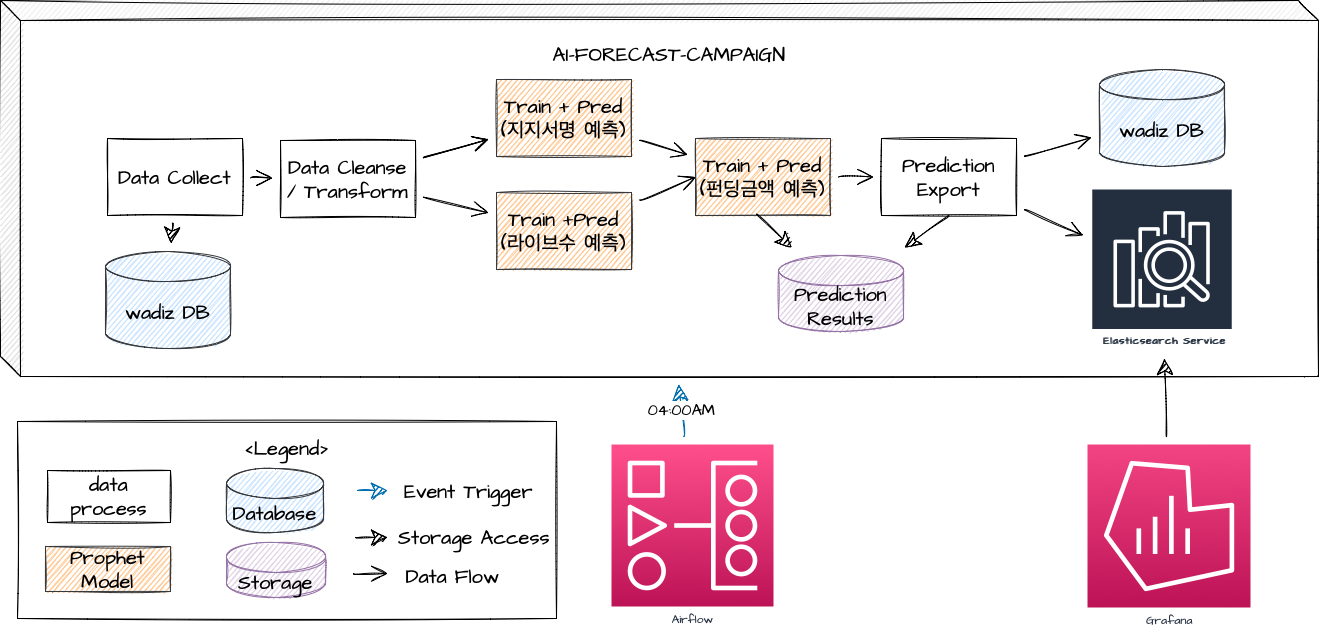
Thanks to Prophet’s simple and fast learning process, we collect the previous day’s data at 4 a.m. every day, clean and transform it, and then perform three structural modeling tasks. The general workflow is as follows.
- Every day at 4:00 PM, Apache AirFlow triggers the AI-Forecast-Campaign.
- The data collector retrieves new data required for training from the wadiz DB, and this data is cleaned and processed into a format suitable for training.
- Endorsement Prediction Model: This model is trained using data on the number of endorsements from three years ago through the previous day to predict the number of endorsements for the coming year. The output of this model serves as the input for the funding amount prediction model.
- Live Project Count Prediction Model: This model is trained using data on the number of live projects from three years ago through the previous day to predict the number of live projects for the coming year. The output of this model serves as the input for the funding amount prediction model.
- Funding Amount Prediction Model: This model predicts funding amounts based on input values for expected number of supporters and expected number of live projects. The final prediction is stored in the internal Elasticsearch and Wadiz database.
- The results stored in ES are displayed via a dashboard in Grafana, as shown in the figure below.
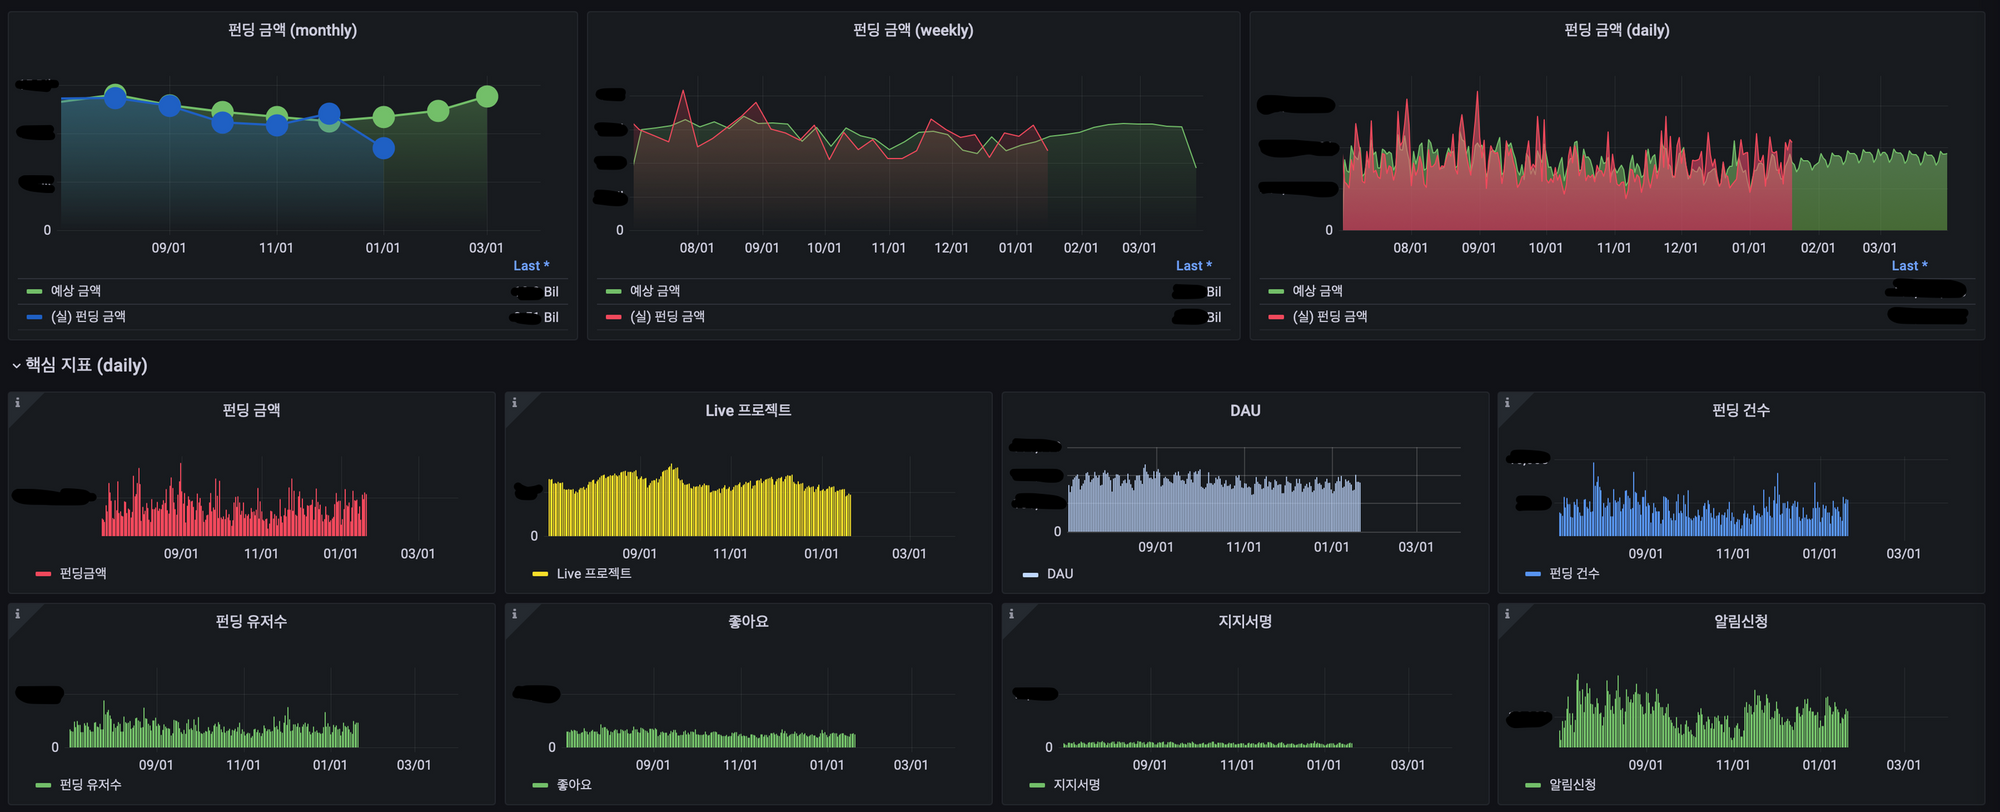
Grafana Monthly Funding Forecast Dashboard
The dashboard aggregates and displays monthly, weekly, and daily funding amounts based on the model’s predictions. It also combines eight key metrics—including funding amounts and the number of live projects—so you can see Wadizkey performance indicators at a glance.
So far, I’ve briefly introduced “Prophet,” Wadizimplemented to forecast total funding amounts, as well as the overall process—including analysis, training, and deployment—used to train it.
Currently, the forecast values from the monthly funding prediction model are accessible at any time via the dashboard introduced above. As a result, it’s being put to good use across the entire company.
As explained in the introduction, Prophet demonstrated that models can be created quickly and efficiently using intuitive visualizations, even without the assistance of time series analysis or statistics experts. We also confirmed that performance can be effectively improved by combining parameters with other features.
Prophet is a tool well-suited for identifying trends and patterns in time series data and is known for its robustness against outliers. However, it’s important to note that predictions may not work well for time series data—such as stock prices—where patterns are inconsistent or heavily influenced by external events. With this in mind, I recommend using Prophet with caution.
Finally, we’re looking for someone to join us in building a machine learning system that leverages Wadizdata to support both makers and backers!
If you’re interested in gaining experience across various fields—including time-series data modeling, recommendation systems, and natural language processing—while building your career alongside great colleagues, don’t hesitate to apply! 😉